
DAY-1 ROI · $0 UPFRONT · NO DISRUPTION · FULLY MANAGED
What keeps you up at night?
Rising costs & margin pressure · The program you couldn't fund · Keeping your best people?
Most vendors solve one of those. We take on the whole financial picture and typically unlock savings of $2,000+ per employee, per year, so you can reinvest in your organization and people. A win-win for everyone.
Start the conversationOr see your baseline savings first
Startups to Fortune 500 · Every industry · All 50 states · Live in 30 to 45 days
10 to 30%+
Saved after full optimization across 60+ categories.
98%
Success rate cutting spend 35% or more.
30 to 45 days
To live. Fully managed, no lift from your team.
1 to 50,000+
Employees. No minimum, no ceiling.
REALITY CHECK
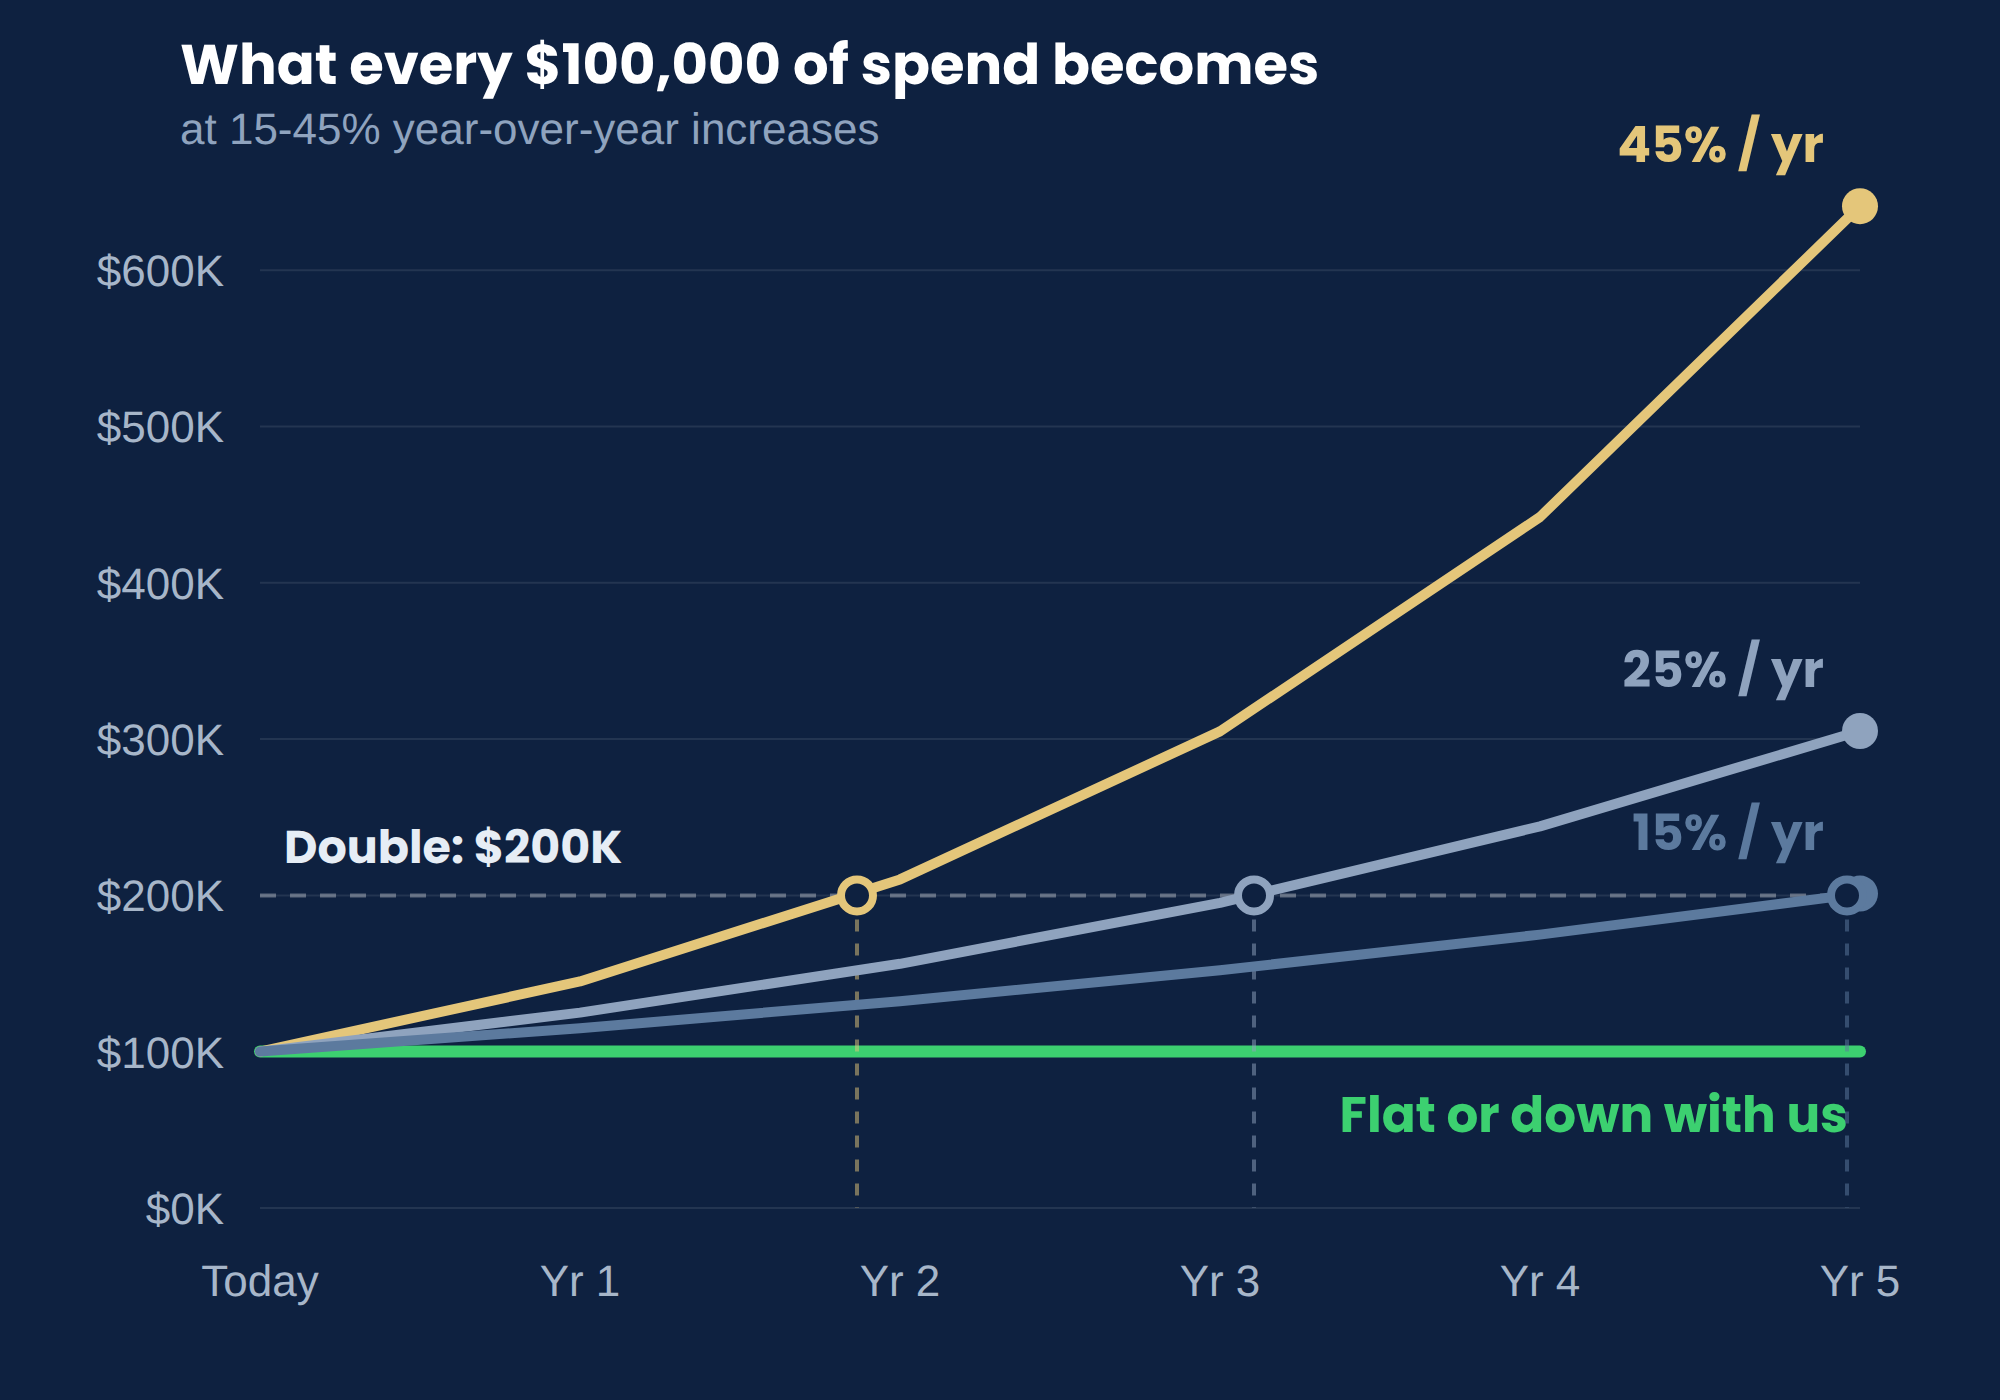
Will you accept a 15-45% YOY increase in costs?
If so, the math says your costs double in 2 to 5 years.
Flat to negative trend is achievable. You're not stuck. There are solutions. Any time of year.
THE UNIT ECONOMICS
How much can you save?
$100,000+ per year for every 50 people.
Per employee, so the math holds at 1 and at 25,000. Realized each pay period, starting in 30 to 45 days.
Multiply your headcount by $2,000+. How does it compare to the increase on your desk?
RECOVERABLE SPEND, PER YEAR
| 1 employee | $2,000+ |
| 12 employees | $24,000+ |
| 50 employees | $100,000+ |
| 250 employees | $500,000+ |
| 1,000 employees | $2,000,000+ |
| 15,000 employees | $30,000,000+ |
There is no minimum and no ceiling.
See your baseline savingsWHY THIS HASN'T REACHED YOU
Has anyone shown you the other shelf?
Carriers appoint brokers. Appointment defines the shelf.
Our programs pay out of the savings they create, so they sit outside it. 99% of the brokers we talk to don't know they exist.
Nothing to switch. Bring your trusted advisors.
INVISIBLE VALUE-ADDS
$0-copay pharmacy on 2,000+ medications
Better-rated doctors in your current network
Indirect spend across 60+ categories
Cost-saving payroll bolt-ons every pay period
Unlimited telehealth & behavioral health for the whole family
WHERE THE MONEY IS
Which of these have you been shown?
Four levers. None touch your plan design. Each stands alone or stacks.
12%
off medical
Better-rated doctors in the same network. Same cards.
15 to 25%
off pharmacy
With 100% of rebates passed through to your plan.
10 to 30%+
off indirect spend
Across 60+ categories. Outside the benefits line.
$0
copay on 2,000+ Rx
Brand, OTC, & specialty worth up to $1,900/mo retail. The whole household.
THREE BASELINE OPTIONS
What would $0 copays actually cost you?
Two are a small cost. The third hands money back every pay period.
Options 1 and 2 are a small cost. Option 3 flips the line item. Which one fits your plan?
THE OBJECTION, ANSWERED
What would you have to give up?
Nothing.
Every lever lowers cost by improving what the member gets.
Better coverage, not less.
✓ Your trusted advisors. Keep the relationship.
✓ Your doctors and cards. No switching.
✓ Your payroll and systems. A pure bolt-on.
✓ Your people. No layoffs, no cost shifting.
✓ Your quality. Nothing gets cut to pay for this.
✓ Your team's workload. Fully managed.
WHO WE CAN HELP
Where do you sit?
Unique solution suites for every industry, every size, all 50 states.

Small employers
A 15 to 45% renewal is a six-figure decision made by someone who doesn't work for you.

Mid-market employers
15 to 25% of plan cost is recoverable without changing carriers. It lands as net margin.

Large enterprise & self-funded
20 to 30% of plan cost you already own. Negative trend, and you keep the claims file.

Brokers, consultants & captives
Keep the relationship. Bring a flat or negative renewal instead of a number to defend.

PEOs & payroll companies
Lower master-plan trend, higher revenue per worksite employee, white-labeled as yours.

Hourly workforces
Real coverage for crews who never qualified. Cash on the next payroll, turnover down.

Private equity & franchisors
$2,000+ per employee back into every unit and portfolio P&L, at $0 upfront.

Healthcare organizations
75 to 85% of denials overturned with no headcount changes. New revenue alongside cost out.

Associations & gig workers
Boost attraction & retention. 10x+ ROI value-add services members can't get alone.
REAL ENGAGEMENTS · ANNUAL, RECURRING SAVINGS · REALIZED MONTHLY
What did they find in the first year?
Annual savings from real engagements, with value realized each month. Nothing was cut, nobody was laid off, and no employee lost a benefit.
$692,300
per year, hospital group
$2.8M
returned to mission, Denver nonprofit
$1.91M
per year, building and safety contractor
$60K to $468K
each, 11 restaurant franchise operators
Client names are withheld. The numbers are not.
See others we've helpedWHAT HAPPENS NEXT
What would it take to get a real number?
A two-minute export from payroll or accounting. No PHI, no RFP.
1
A 15-minute call
Headcount, funding type, renewal date. We map which levers apply.
2
A no-cost analysis
We model your actual spend. A hard number back in days.
3
You decide, we deliver
Live in 30 to 45 days. You realize savings every month.
No cost for the analysis. We're paid only if you save.
Start the conversationQUESTIONS WE GET A LOT
You might be wondering...
What does Save with Benefits actually do?
How can costs go down without cutting benefits?
What does it cost?
Is there a minimum company size?
Do I have to change my broker, carrier, or plan?
How fast does it start, and do I have to wait for renewal?
What do you need from us for the analysis?
Why hasn't my broker shown me this?
OUR DIFFERENTIATED VALUE
How are we different?
We don't believe a 15% YOY increase is acceptable. Flat or negative is the goal, and we achieve 35%+ savings 98%+ of the time, and have won awards for doing so. We work the places standard channels never see, don't stop until we find you savings, and structure a win-win so every party comes out ahead.
Cutting costs shouldn't mean cutting value, and it doesn't have to.
We have sat in your chair
CEO, COO and private equity operators. You get someone who reads a P&L the way you do.
We know the playbook
Ran health economics centers of excellence inside major payers. We know where the savings levers are.
You keep every relationship
Advisory, not vendor. Long-term partnerships, and we're paid only out of what we save you.
What got delayed this year that those dollars could have funded?
Bring your trusted advisors. The analysis costs nothing either way.
Start the conversation